This report provides the current industrial vacancy rate for buildings over 10,000m2 across the three capital cities on the Eastern Seaboard.
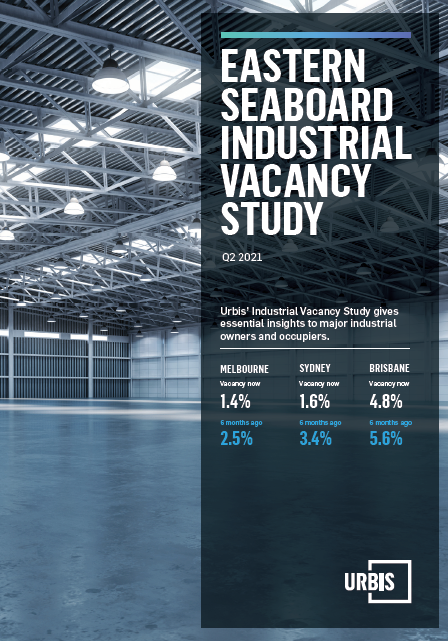
Overall, we’re seeing vacancy rates continue to come down in all markets, with Melbourne and Sydney now at particularly low vacancy levels. The stats are 1.4% in Melbourne, 1.6% in Sydney and 4.8% in Brisbane.
The Q2 2021 statistics resulted in a decrease in the overall vacancy rate over the past quarter, and in most states – perhaps not unsurprisingly – a number of speculative developments were paused due to COVID-driven conservatism.
The strength in the market, particularly on the demand/occupier side, is such that most major developers will now have the confidence to progress speculative development (particularly in the very tight Melbourne and Sydney markets) although the lag in commencement is likely to have vacancies remain low for the short term. Likewise, land supply constraints in the key sub-markets continue to limit the volume of speculative development that can be delivered at any one time.
Click on the thumbnail below to download a copy of the report.