Digital products
In a data-rich world, Urbis helps you surface insights that matter.
Urbis Loop - the source of truth for cities
Our dashboards are designed to set you apart, offering you key insights powered by over 50 years of consulting excellence. Make better decisions, gain new insights, and stay on top of relevant trends with Loop.
We're committed to providing the insights and tools you need to shape the future of our cities and communities. Our digital products, accessible via the Urbis Loop website, are designed to empower you with the data and analysis necessary to make informed decisions.
Visit Loop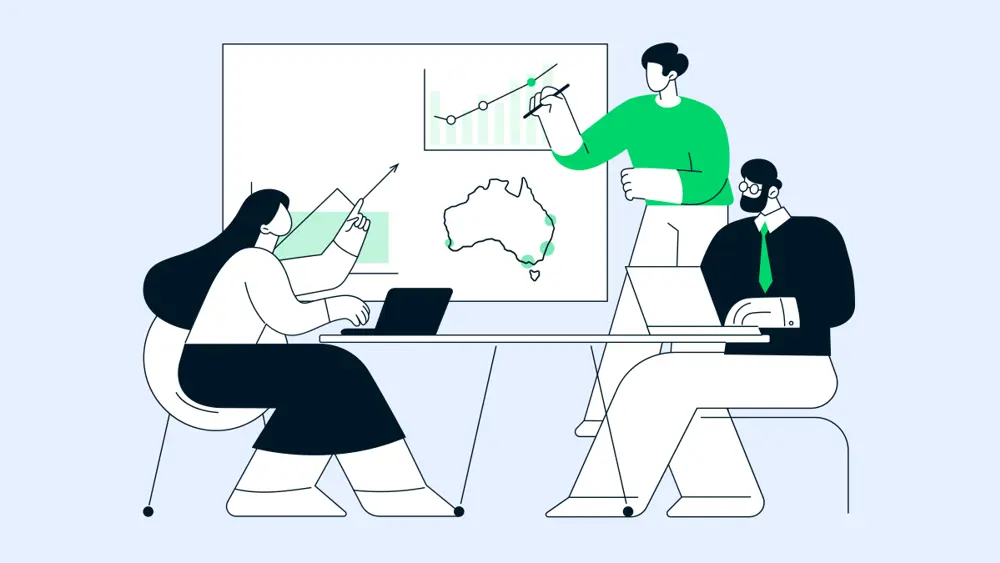
Our key offerings include:
Shopping Centre Benchmarks
For over 33 years, our Shopping Centre Benchmarks have provided essential data and insights to help industry professionals understand and improve shopping centre performance. Access detailed metrics and benchmark your centre’s performance with our interactive dashboard.
Read more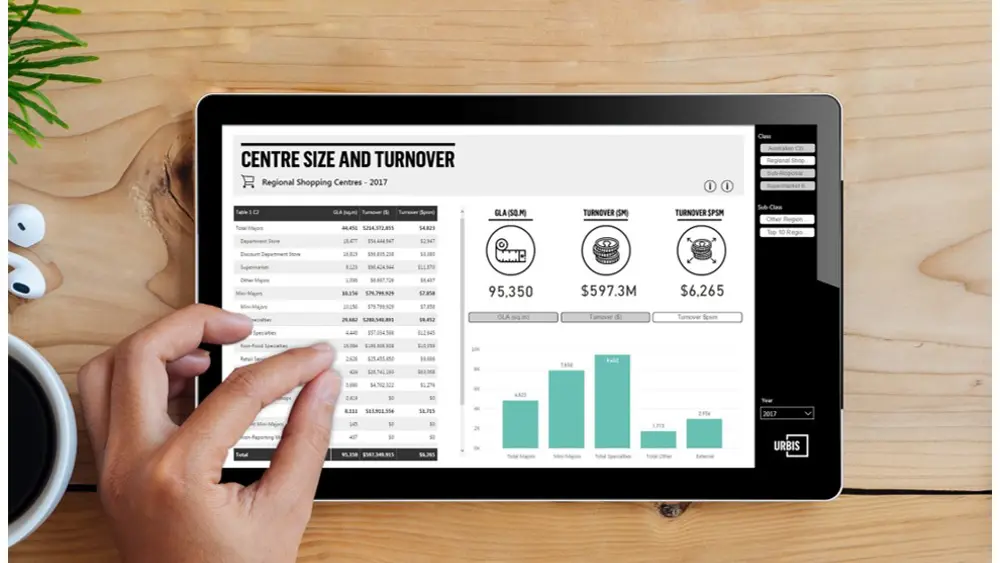
Student Accommodation Benchmarks
Our USAB platform tracks the Australian student accommodation sector, providing comprehensive data on existing supply, development pipeline, room mix, rents, occupancy rates, and more. Developed in collaboration with industry leaders, it helps you make informed decisions in this growing asset class.
Read more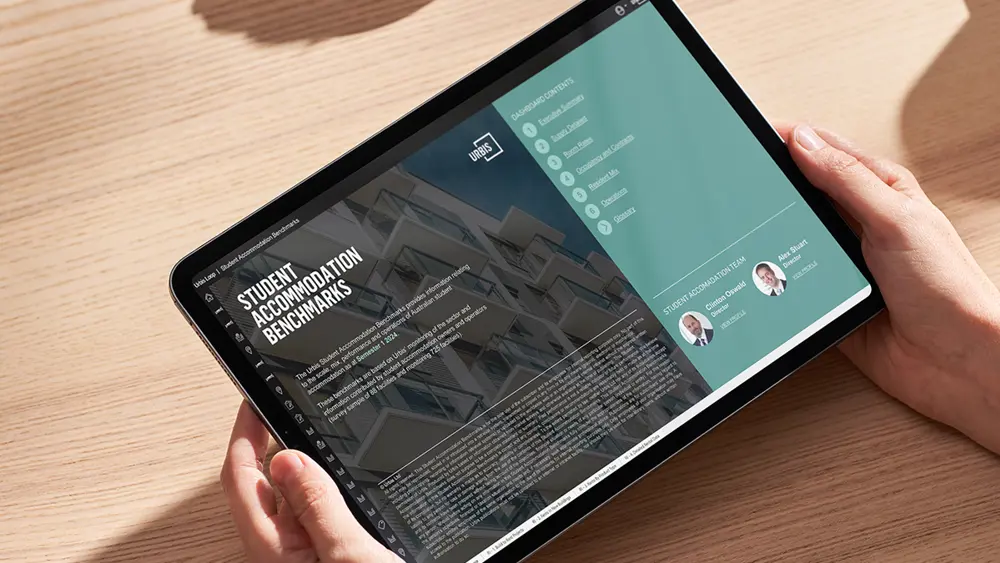
Apartment Market Essentials
Our Apartment Market Essentials Platform offers insights on the apartment market across Australia’s major cities. We track all apartment projects from Development Application to completion, providing data on sales, supply, and rents. Choose from our Core and BTR modules for tailored insights.
Read more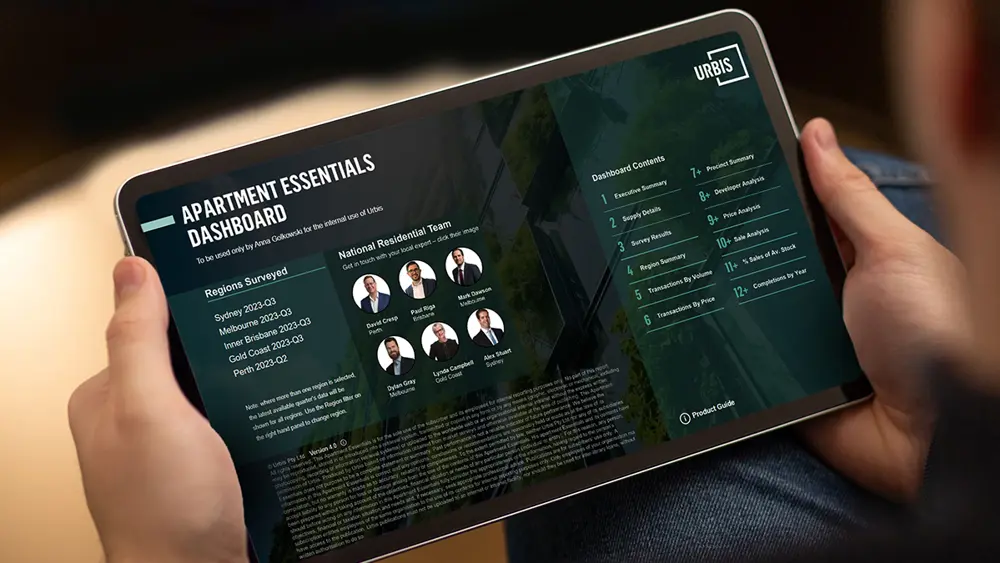
Census Dashboard
Leverage the ABS Census data with our online dashboard. Overlay important Census data with your retail trade area to track key changes, probe deeper into demographics, and access market data at the touch of a button. Visualise socio-demographic features and compare trade area characteristics across your portfolio.
Read more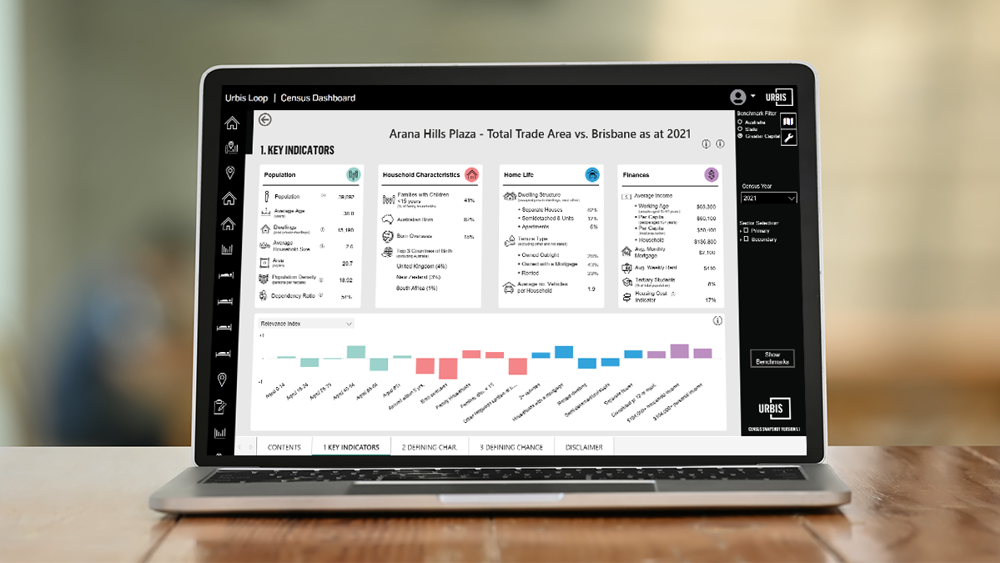
Shape the future with Urbis Loop
Subscribe today to shape tomorrow. With our comprehensive digital products, you have the tools to prepare for and shape the future of retail and residential environments. Let’s build a better future together. Contact our team today to learn more or visit Loop here.